Affordability Index
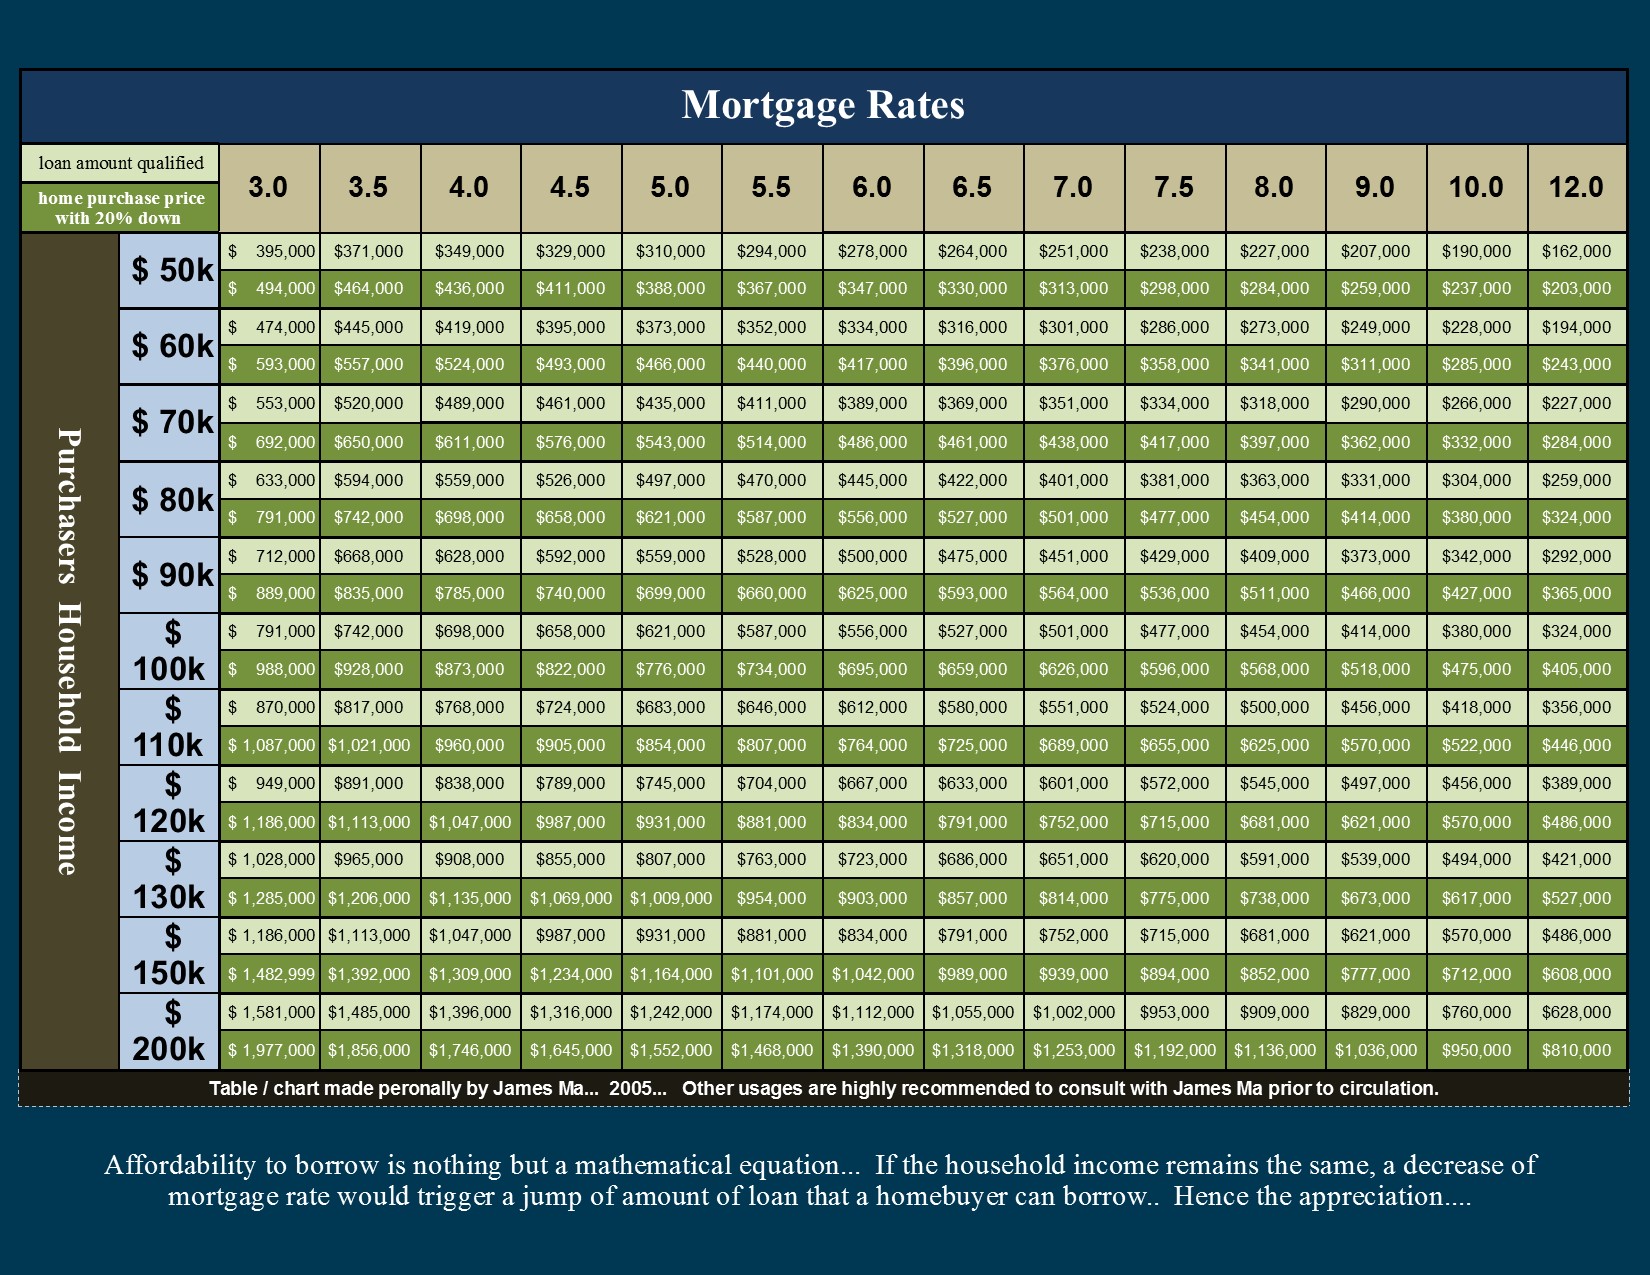
Affordability is Nothing but a Mathematical Equation... This table below indicates how much a buyer can qualify for, based on a 40% debt ratio, in respective to the mortgage rates... For example, an $80,000 annual household income, with 20% down, at 9% interest rate (about 1992), can afford a house of $414,000. If the income does not change, this family can afford a $698,000 purchase price if the rate is lowered to 4% (during the subprime)... In other words, if the household income remains the same, the decrease of mortgage rate would cause the housing price to inflate... And once the subprime programs ended (about 2005), the mortgage went back to their standard rate (about 6.5%). When it happened, affordability dropped, and thus the housing price faltered... This explains the $200,000 to $300,000 appreciation from about 2002 to 2006 and the market correction between 2007 and 2010...
There is no inflation in housing market. It is just a mathematical equation, based on the household income and the mortgage rate.


